4 Representativity
There are two types of dropout: internal dropout and external dropout.
Internal dropout implies that survey respondents for whatever reason does no respond to the questions they are asked, or that the response is invalid. Normally, the latter is not as big problem in an online questionnaire as in i.e. paper surveys. Online questionnaires has built-in validation in the user interface in order to avoid invalid responses.
In our surveys, “not answered” is coded as 97. Across all survey questions in round 1, the average interal dropout is 1.8 percent. Note that we do not count “dont know” or “dont want to answer” as internal dropout. Also note that respondents that has answered a insufficient number of questions in the survey is calculated as external dropout.
The external dropout describes the group of respondents who fails to respond to the survey. Some individuals actively dropout (1 686 individuals in round 1). Others fail to answer a sufficient number of questions to be included in the data (6 867). In total, National Crime Survey was in one way or another in contact with 8 553 indviduals (12.6 percent) who in the end did not participate. In other words, the largest dropout is due to the silent majority who did not actively drop out nor participate.
In total, the external dropout in round 1 was 65.5 percent.
4.1 Response rate
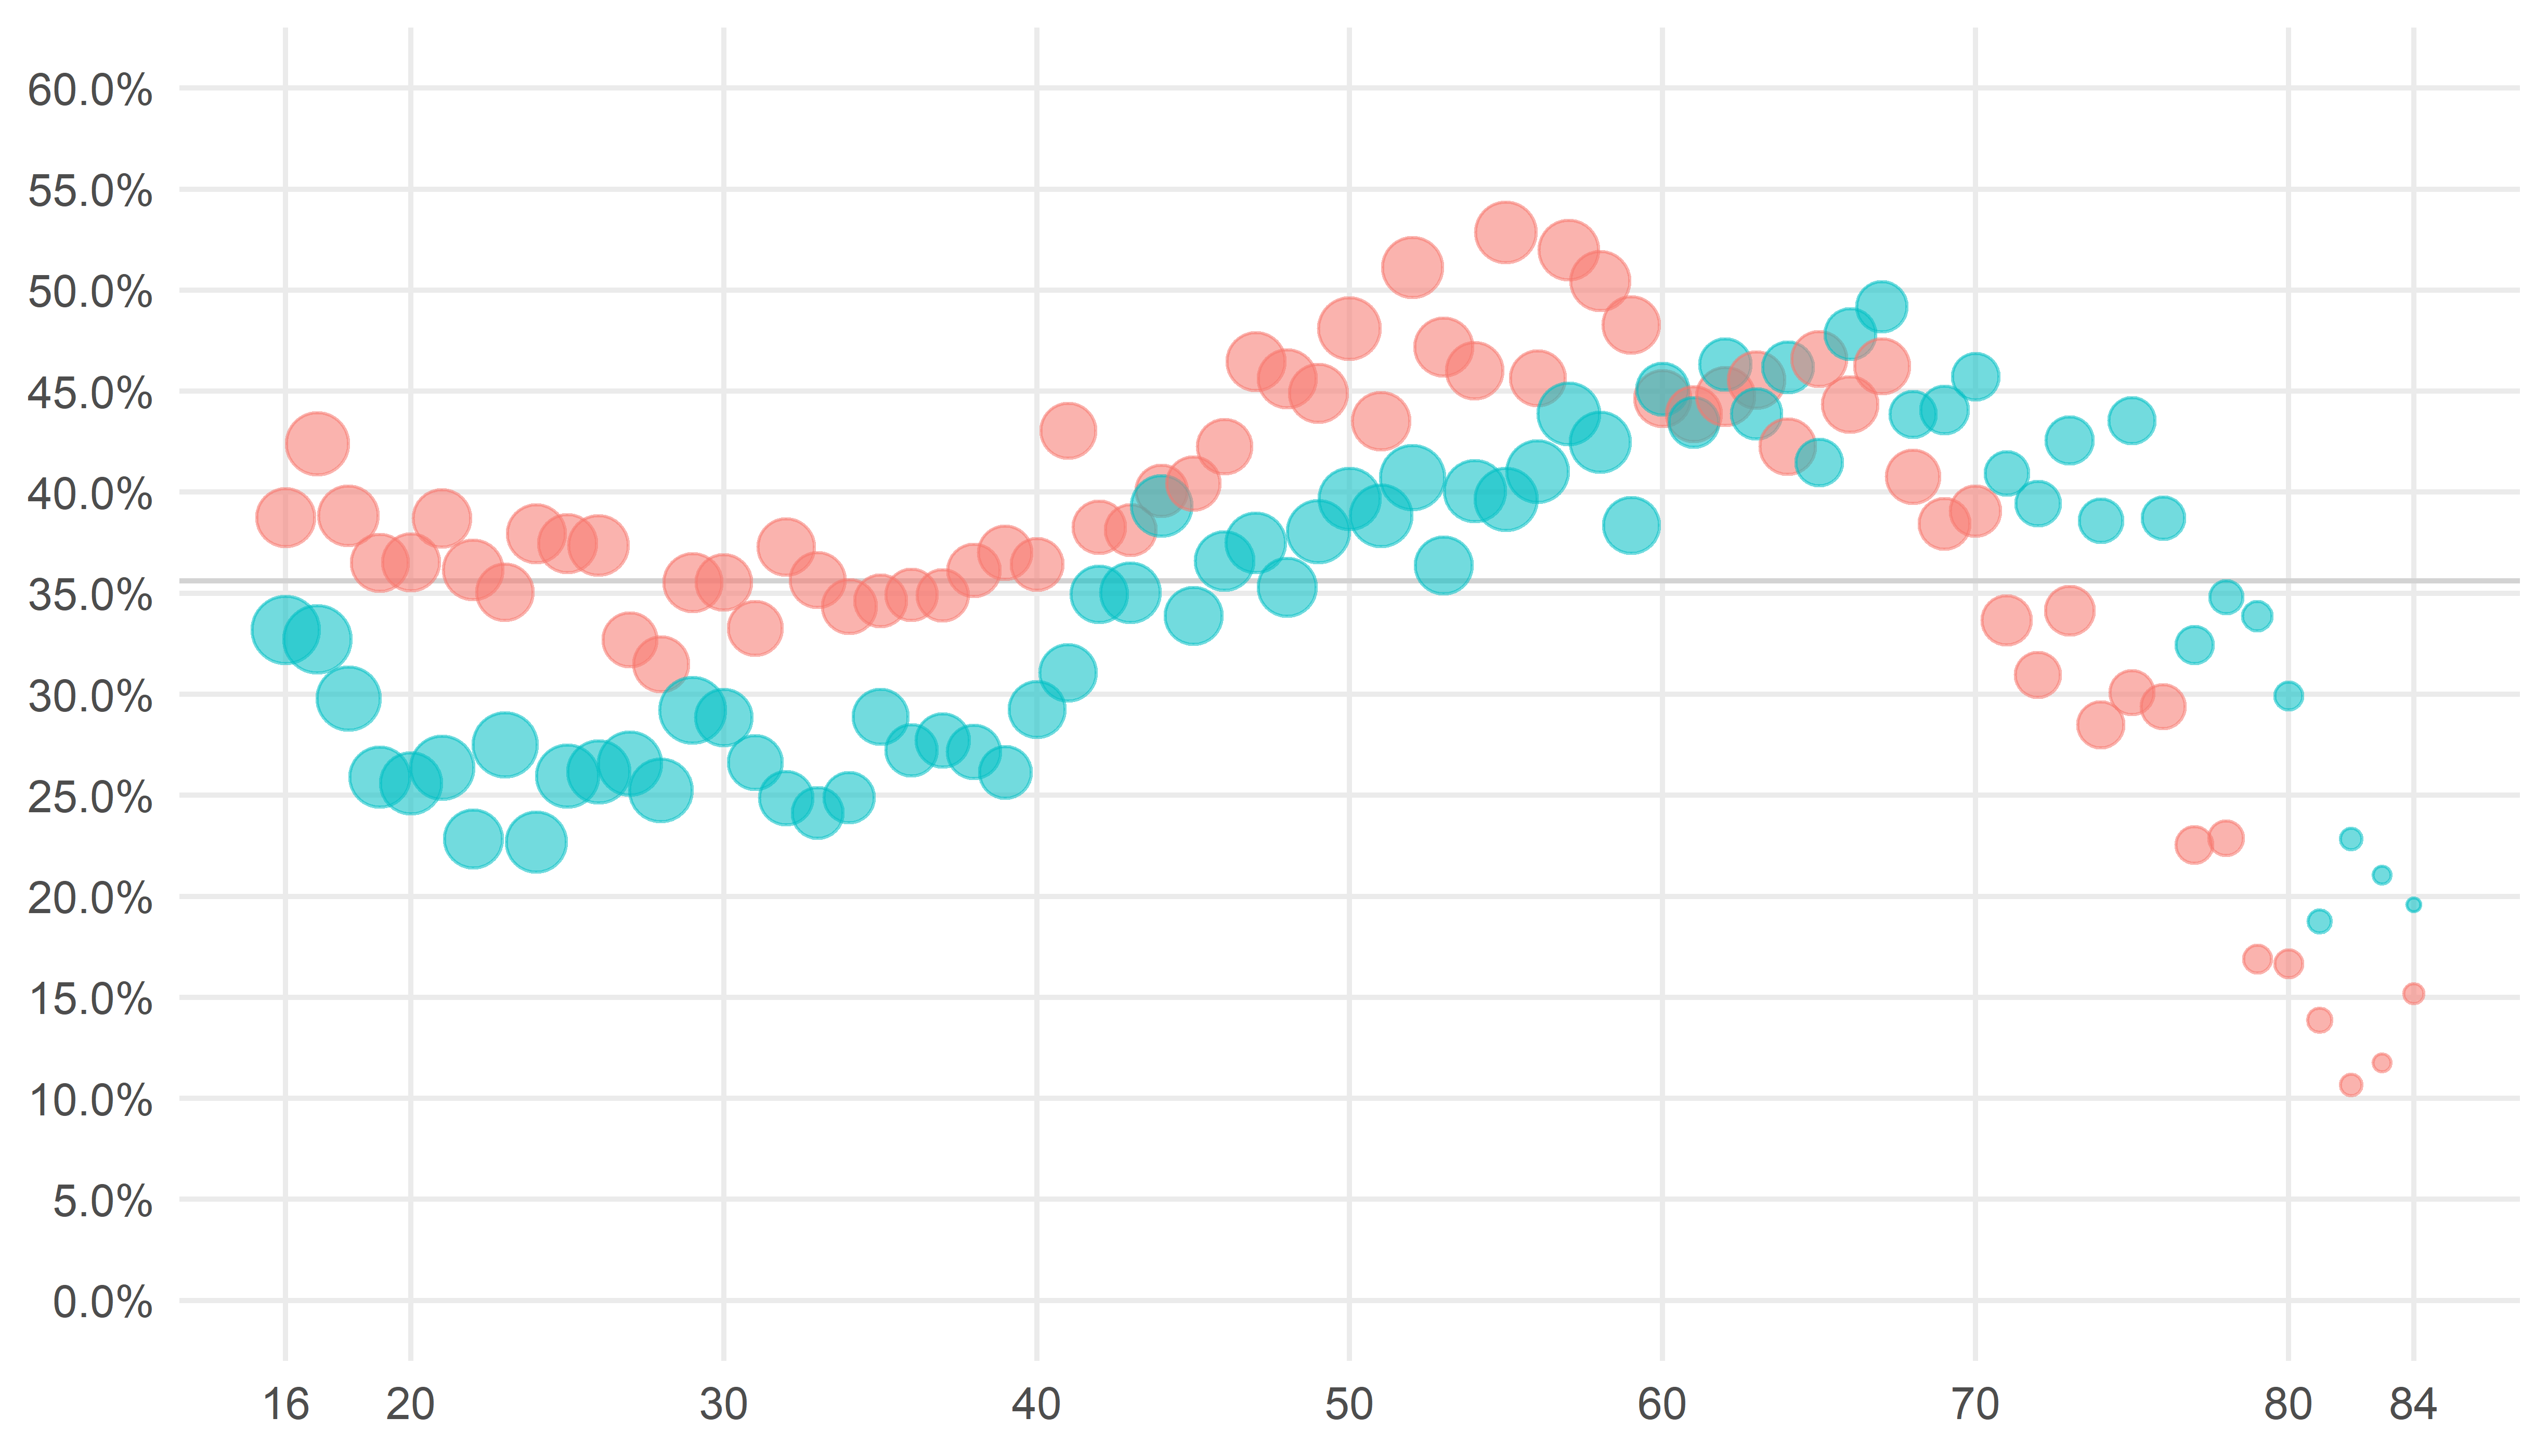
The response rate varies according to the respondents demographic characteristics. Women are more inclined to participate than men, with the exception of men above 59 years who has a higher response rate than their female counterpart (figure below). There are also some geographical differences. Respondents from Oslo has seven percentage points higher response rate than respondents from Innlandet.
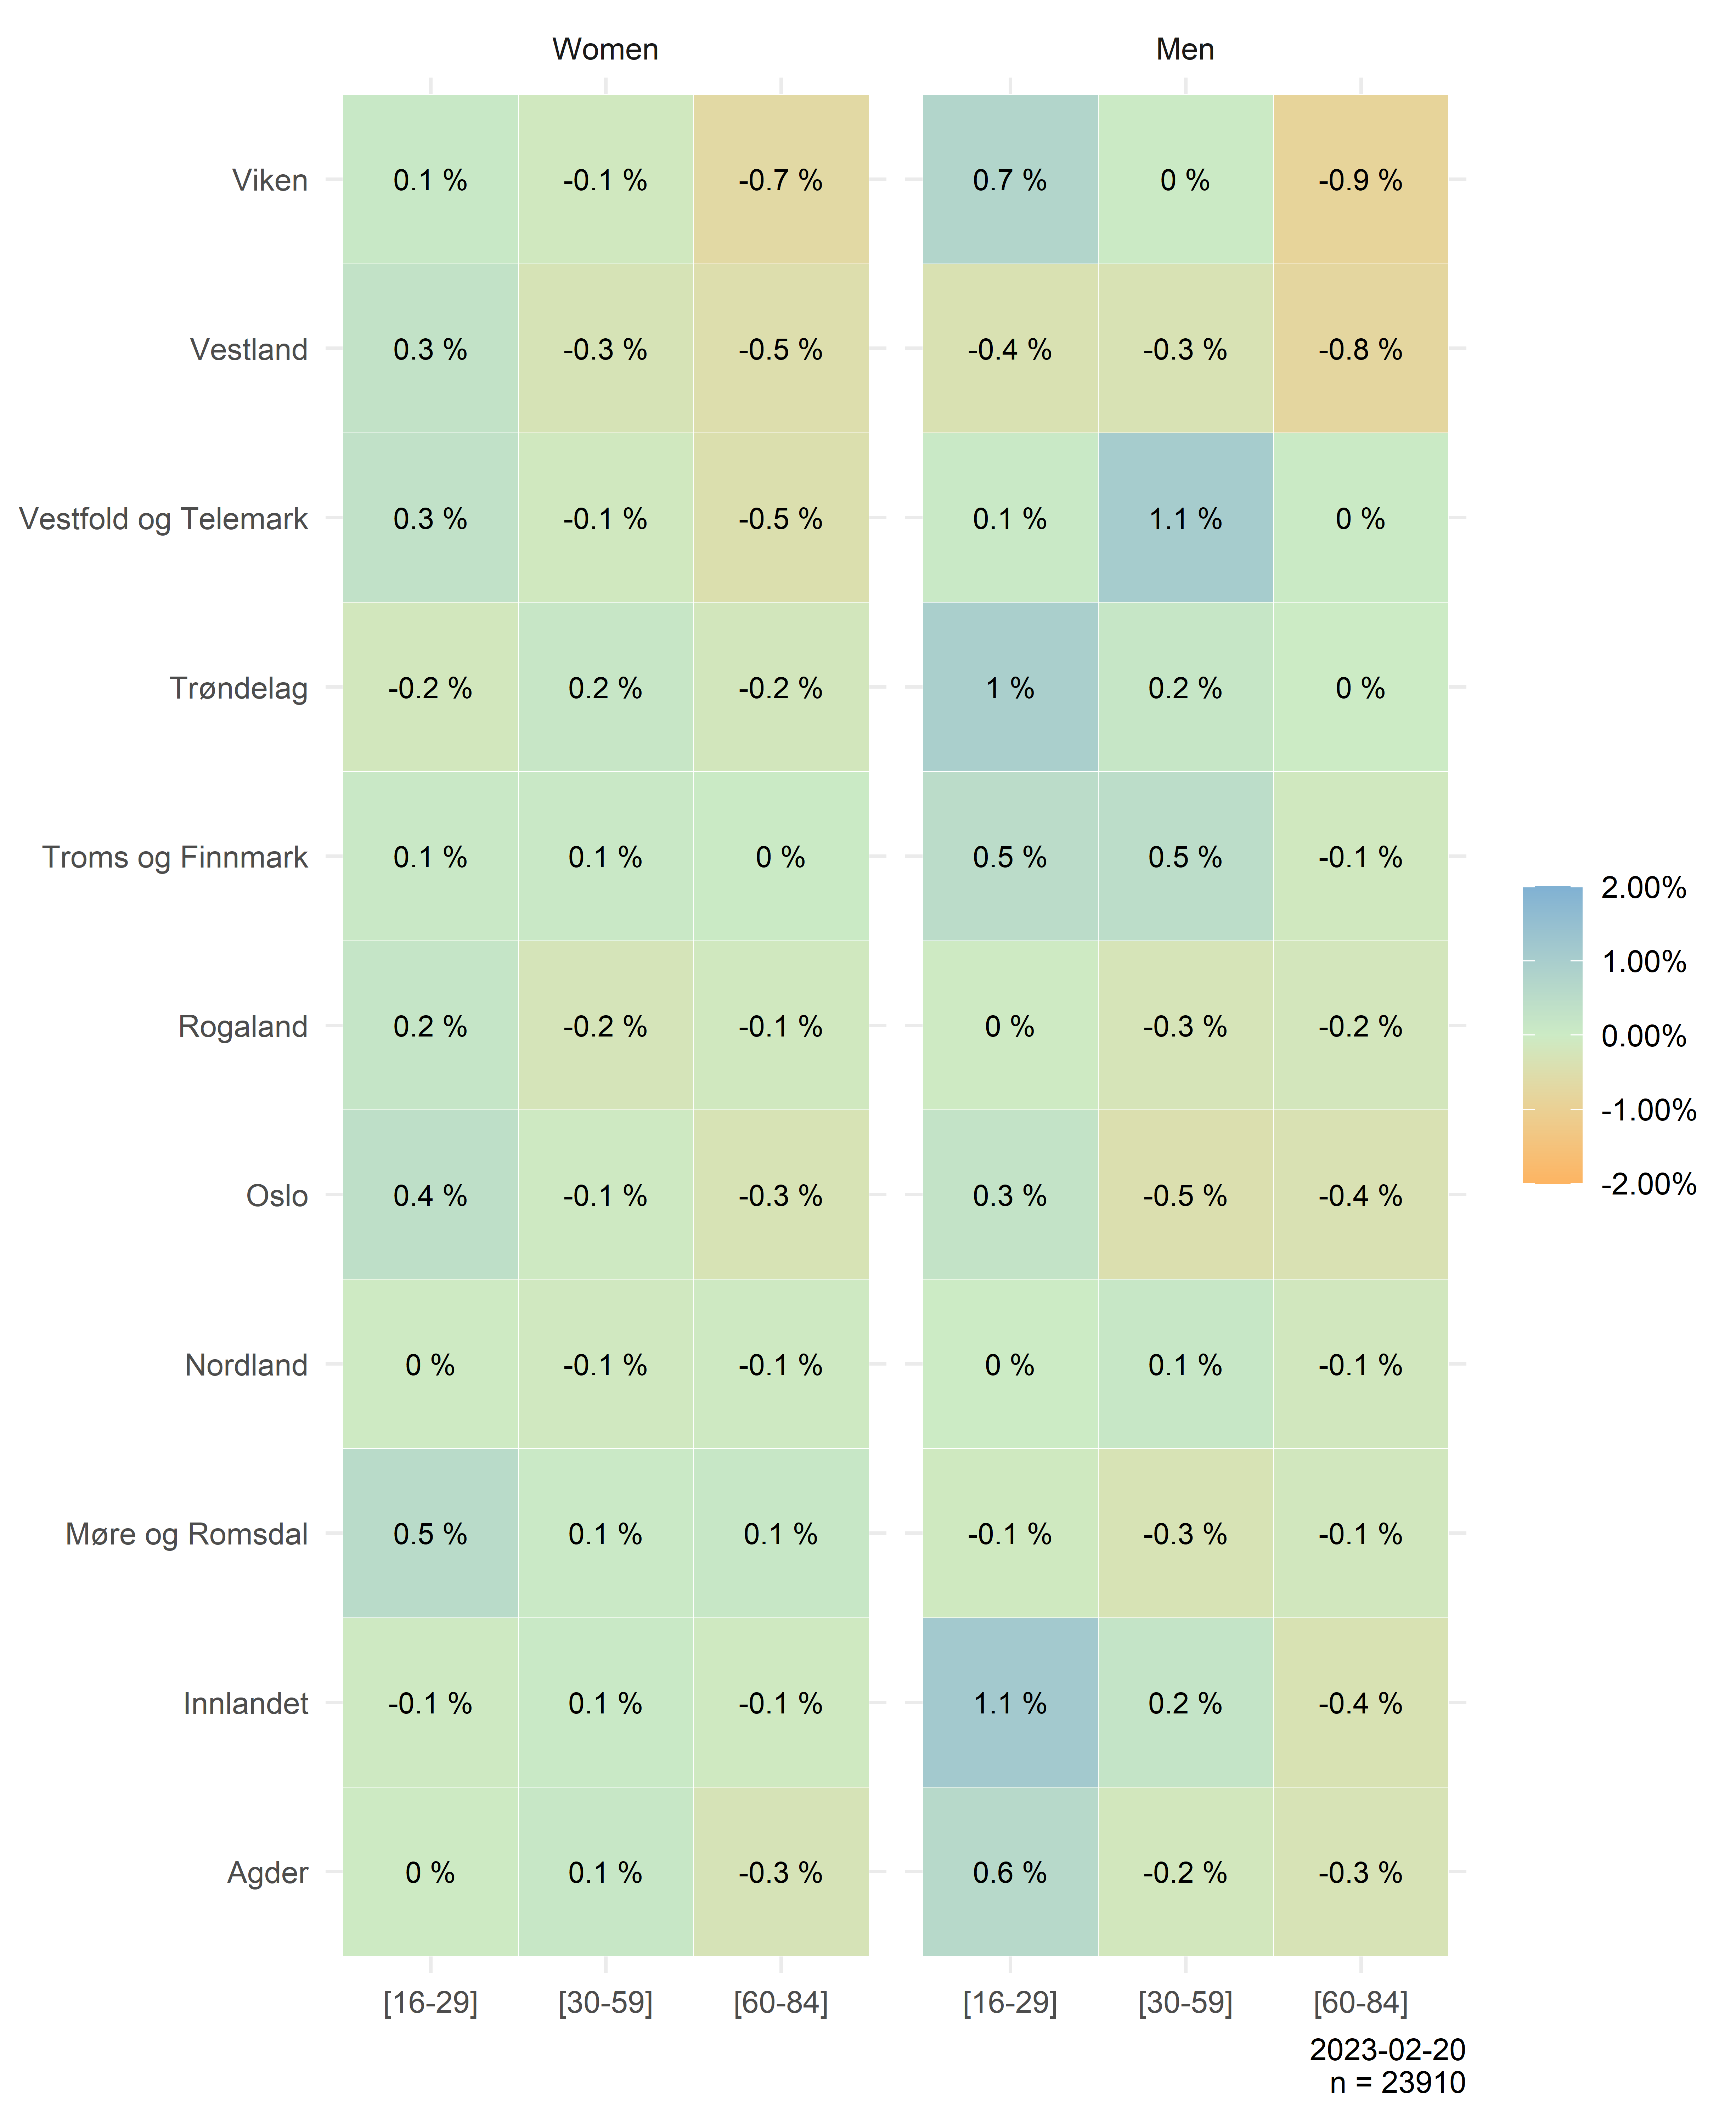
Even though some respondents are more inclined to participate compared to others, the representativity of different groups of age, gender and geography is quite good due to the stratification procedure. The figure below compares the relative size of the different strata´s in the net sample with the population. 0 indicates perfect representation. Sub-zero indicates underrepresentation, and values greater than zero indicates overrepresentation.
It is possible to account for participation biases along known characteristics. Gender, age and geography is information available from the population registry. Education level is not a feature available in the population registry. The figure below reveals a significant bias when comparing the education level of the net sample to the population.
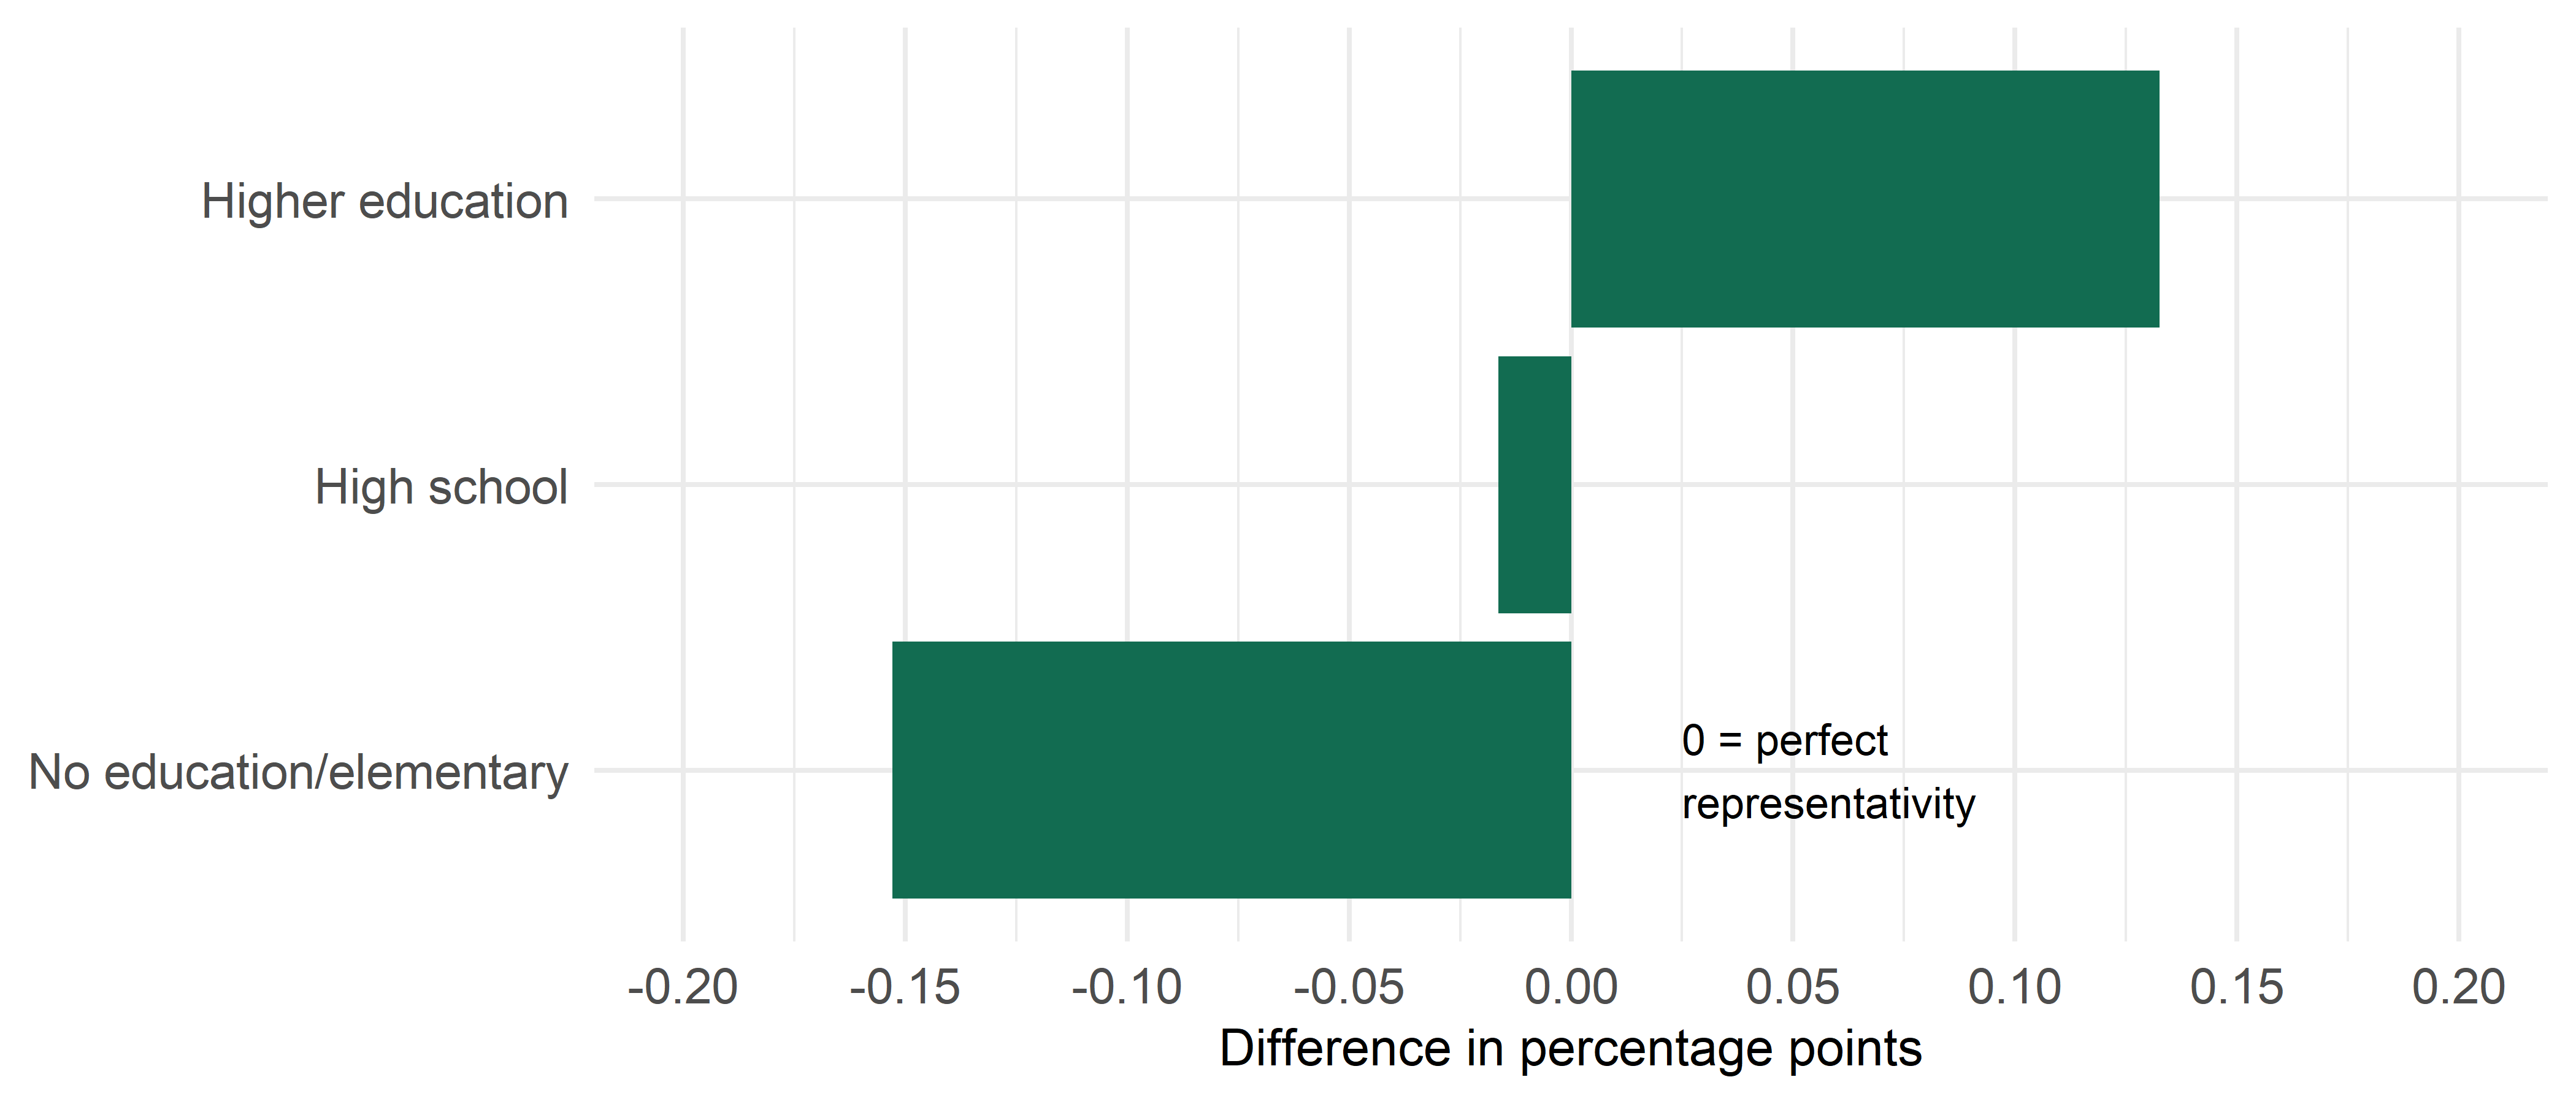
We recommend applying the post-stratification weight, weight_edu, when analyzing data from the National Crime Survey. When applying the weight, the self-reported level of education in the net sample is much closer to the distribution in the population.